class: center, middle, inverse, title-slide # Prettiness with ggplot2 ## Amy Perfors ### <br><br>adapted from Danielle Navarro: <a href="https://djnavarro.github.io/chdss2018/day2/ggplot-slides.html" class="uri">https://djnavarro.github.io/chdss2018/day2/ggplot-slides.html</a><BR><a href="https://djnavarro.github.io/satrdayjoburg/" class="uri">https://djnavarro.github.io/satrdayjoburg/</a> ### 18 December 2019 --- class: split-two bg-main1 .column.bg-main1[.content.vmiddle.center[ # Data visualisation ]] .column.bg-main3[.content.vmiddle.center[ <img src="images/horst_ggplot.png", width="70%"> [@allison_horst](https://twitter.com/allison_horst) ]] <!-- *********** NEW SLIDE ************** --> --- class: bg-main1 center middle hide-slide-number .reveal-text.bg-main2[.pad1[ .font4[A plot of the<BR>frames data] ]] <!-- *********** NEW SLIDE ************** --> --- class: bg-main1 middle center .pull.left[.pad1[.font2[ ```r # load data frames <- read_csv(here("data","frames_ex2.csv")) # show data frames ``` ``` ## # A tibble: 4,725 x 8 ## id gender age condition sample_size n_obs test_item response ## <dbl> <chr> <dbl> <chr> <chr> <dbl> <dbl> <dbl> ## 1 1 male 36 category small 2 1 8 ## 2 1 male 36 category small 2 2 7 ## 3 1 male 36 category small 2 3 6 ## 4 1 male 36 category small 2 4 6 ## 5 1 male 36 category small 2 5 5 ## 6 1 male 36 category small 2 6 6 ## 7 1 male 36 category small 2 7 3 ## 8 1 male 36 category medium 6 1 9 ## 9 1 male 36 category medium 6 2 7 ## 10 1 male 36 category medium 6 3 5 ## # … with 4,715 more rows ``` ]]] <!-- *********** NEW SLIDE ************** --> --- class: split-40 bg-main1 .column.bg-main1[.content.vtop.center[ # Summarise frames data .pull.left[.pad1[.font2[ ```r frames_small <- frames %>% group_by( age, condition, sample_size ) %>% summarise( response = mean(response) ) %>% ungroup() frames_small ``` ]]] ]] .column.bg-main3[.content.vtop.center[ .pull.left[.pad1[.font2[ ``` ## # A tibble: 231 x 4 ## age condition sample_size response ## <dbl> <chr> <chr> <dbl> ## 1 20 category large 3.86 ## 2 20 category medium 4.21 ## 3 20 category small 4.93 ## 4 20 property large 4.37 ## 5 20 property medium 4.31 ## 6 20 property small 3.74 ## 7 21 category large 5.5 ## 8 21 category medium 5.04 ## 9 21 category small 5.46 ## 10 21 property large 3.71 ## # … with 221 more rows ``` ]]] ]] <!-- *********** NEW SLIDE ************** --> --- class: split-40 bg-main1 .column.bg-main1[.content.vtop.center[ .pull.left[.pad1[.font2[ A simple plot ```r ggplot( frames_small, aes(age, response) ) + geom_point() ``` - A little verbose? - Not the prettiest plot? - Why is it like this? ]]] ]] .column.bg-main3[.content.vtop.center[ .pad1[.font2[ 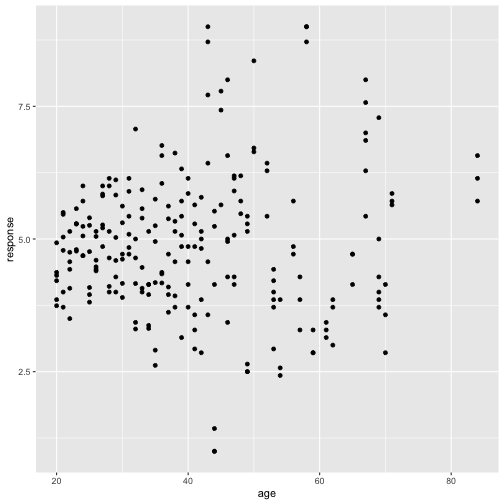<!-- --> ]] ]] <!-- *********** NEW SLIDE ************** --> --- class: bg-main1 center middle hide-slide-number .reveal-text.bg-main2[.pad1[ .font4[Painting a Picture] ]] <!-- *********** NEW SLIDE ************** --> --- class: split-50 bg-main1 .column.bg-main1[.content.vtop.center[ .pull.left[.pad1[.font7[ .center[ # ggplot2 is... ] <br> ## A grammar... - grammars compose & reuse small parts - complex structures from simpler units ## ...of graphics - uses the "painters model" - a plot is built in layers - each layer is drawn on top of the last ]]] ]] .column.bg-main3[.content.vmiddle.center[ <img src="images/trinity-treft-696428-unsplash.jpg", width="70%"> [Image credit: Trinity Treft](https://unsplash.com/photos/waYWz3vAYJQ) ]] <!-- *********** NEW SLIDE ************** --> --- class: split-50 bg-main1 .column.bg-main1[.content.vtop.center[ .pull.left[.pad1[.font2[ A blank canvas ```r ggplot() ``` ]]] ]] .column.bg-main3[.content.vtop.center[ .pad1[.font2[ <!-- --> ]] ]] <!-- *********** NEW SLIDE ************** --> --- class: split-50 bg-main1 .column.bg-main1[.content.vtop.center[ .pull.left[.pad1[.font2[ Specify the .orange[data] ```r ggplot( * data = frames_small ) ``` ]]] ]] .column.bg-main3[.content.vtop.center[ .pad1[.font2[ <!-- --> ]] ]] <!-- *********** NEW SLIDE ************** --> --- class: split-50 bg-main1 .column.bg-main1[.content.vtop.center[ .pull.left[.pad1[.font2[ A .orange[mapping] from data onto plot .orange[aesthetics] ```r ggplot( data = frames_small, * mapping = aes( * x = age, * y = response * ) ) ``` - .orange[x]-axis location - .orange[y]-axis location - .orange[colour] of marker - .orange[fill] of a marker - .orange[shape] of a marker, etc. ]]] ]] .column.bg-main3[.content.vtop.center[ .pad1[.font2[ <!-- --> ]] ]] <!-- *********** NEW SLIDE ************** --> --- class: split-50 bg-main1 .column.bg-main1[.content.vtop.center[ .pull.left[.pad1[.font2[ Add a plot .orange[layer] ```r ggplot( data = frames_small, mapping = aes( x = age, y = response ) ) + *geom_point() ``` - the .orange[points] - the .orange[lines] - the .orange[histograms] - etc ]]] ]] .column.bg-main3[.content.vtop.center[ .pad1[.font2[ <!-- --> ]] ]] <!-- *********** NEW SLIDE ************** --> --- class: split-50 bg-main1 .column.bg-main1[.content.vtop.center[ .pull.left[.pad1[.font2[ Add layer-specific parameters ```r ggplot( data = frames_small, mapping = aes( x = age, y = response ) ) + *geom_point(size = 3) ``` ]]] ]] .column.bg-main3[.content.vtop.center[ .pad1[.font2[ 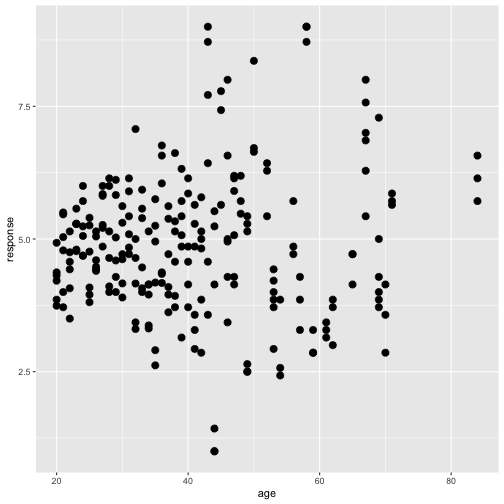<!-- --> ]] ]] <!-- *********** NEW SLIDE ************** --> --- class: split-50 bg-main1 .column.bg-main1[.content.vtop.center[ .pull.left[.pad1[.font2[ Add layer-specific mappings ```r ggplot( data = frames_small, mapping = aes( x = age, y = response, colour = condition ) ) + *geom_point(size = 3) ``` ]]] ]] .column.bg-main3[.content.vtop.center[ .pad1[.font2[ 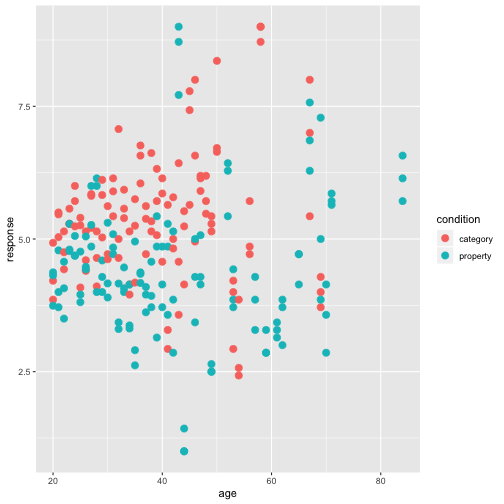<!-- --> ]] ]] <!-- *********** NEW SLIDE ************** --> --- class: split-50 bg-main1 .column.bg-main1[.content.vtop.center[ .pull.left[.pad1[.font2[ Add more layers to the plotcake ```r ggplot( data = frames_small, mapping = aes( x = age, y = response, colour = condition ) ) + geom_point(size = 3) + *geom_rug() ``` ]]] ]] .column.bg-main3[.content.vtop.center[ .pad1[.font2[ <!-- --> ]] ]] <!-- *********** NEW SLIDE ************** --> --- class: split-50 bg-main1 .column.bg-main1[.content.vtop.center[ .pull.left[.pad1[.font2[ Split into .orange[facets] ```r ggplot( data = frames_small, mapping = aes( x = age, y = response, colour = condition ) ) + geom_point(size = 3) + geom_rug() + *facet_wrap(vars(sample_size)) ``` ]]] ]] .column.bg-main3[.content.vtop.center[ .pad1[.font2[ <!-- --> ]] ]] <!-- *********** NEW SLIDE ************** --> --- class: split-50 bg-main1 .column.bg-main1[.content.vtop.center[ .pull.left[.pad1[.font2[ Modify the .orange[theme] ```r ggplot( data = frames_small, mapping = aes( x = age, y = response, colour = condition ) ) + geom_point(size = 3) + geom_rug() + facet_wrap(vars(sample_size)) + *theme_bw() ``` ]]] ]] .column.bg-main3[.content.vtop.center[ .pad1[.font2[ <!-- --> ]] ]] <!-- *********** NEW SLIDE ************** --> --- class: split-50 bg-main1 .column.bg-main1[.content.vtop.center[ .pull.left[.pad1[.font2[ (Nothing to see here...) ```r ggplot( data = frames_small, mapping = aes( x = age, y = response, colour = condition)) + geom_point(size = 3) + geom_rug() + facet_wrap(vars(sample_size)) + theme_bw() ``` ]]] ]] .column.bg-main3[.content.vtop.center[ .pad1[.font2[ <!-- --> ]] ]] <!-- *********** NEW SLIDE ************** --> --- class: split-50 bg-main1 .column.bg-main1[.content.vtop.center[ .pull.left[.pad1[.font2[ Make nicer titles ```r ggplot( data = frames_small, mapping = aes( x = age, y = response, colour = condition ) ) + geom_point(size = 3) + geom_rug() + facet_wrap(vars(sample_size)) + theme_bw() + *labs( * title = "Response by age", * subtitle = "Varying condition and sample size", * x = "Age (years)", * y = "Response (1=no, 9=yes)" *) ``` ]]] ]] .column.bg-main3[.content.vtop.center[ .pad1[.font2[ <!-- --> ]] ]] <!-- *********** NEW SLIDE ************** --> --- class: split-50 bg-main1 .column.bg-main1[.content.vtop.center[ .pull.left[.pad1[.font2[ Done! Our plotcake is baked. ```r ggplot( data = frames_small, mapping = aes( x = age, y = response, colour = condition ) ) + geom_point(size = 3) + geom_rug() + facet_wrap(vars(sample_size)) + theme_bw() + labs( title = "Response by age", subtitle = "Varying condition and sample size", x = "Age (years)", y = "Response (1=no, 9=yes)" ) ``` ]]] ]] .column.bg-main3[.content.vtop.center[ .pad1[.font2[ <!-- --> ]] ]] <!-- *********** NEW SLIDE ************** --> --- class: split-50 bg-main1 .column.bg-main1[.content.vtop.center[ .pull.left[.pad1[.font2[ All the ingredients are needed! - Data - Aesthetics - Layers - Facets - Theme - (Coordinates) - (Scales) ]]] ]] -- .column.bg-main3[.content.vtop.center[ .pull.left[.pad1[.font2[ So when I type this... ```r ggplot( frames_small, aes(age, response) ) + geom_point() ``` ]]] ]] <!-- *********** NEW SLIDE ************** --> --- class: split-50 bg-main1 .column.bg-main1[.content.vtop.center[ .pull.left[.pad1[.font2[ All the ingredients are needed! - Data - Aesthetics - Layers - Facets - Theme - (Coordinates) - (Scales) ]]] ]] .column.bg-main3[.content.vtop.center[ .pull.left[.pad1[.font2[ What I get is this... ```r ggplot( data = frames_small, mapping = aes( x = age, y = response)) + layer( geom = "point", stat = "identity", position = "identity") + facet_null() + theme_grey() + coord_cartesian() + scale_x_continuous() + scale_y_continuous() ``` ]]] ]] <!-- *********** NEW SLIDE ************** --> --- class: white bg-black center middle hide-slide-number .pad1[ .font4[ Exercise 01<br> ]] <!-- *********** NEW SLIDE ************** --> --- class: bg-main1 center middle hide-slide-number .reveal-text.bg-main2[.pad1[ .font4[Aesthetics] ]] <!-- *********** NEW SLIDE ************** --> --- class: split-40 bg-main1 .column.bg-main1[.content.vtop.center[ # New summary of data .pull.left[.pad1[.font2[ ```r frames_test <- frames %>% group_by( test_item, condition, sample_size ) %>% summarise( response = mean(response) ) %>% ungroup() frames_test ``` ]]] ]] .column.bg-main3[.content.vtop.center[ .pull.left[.pad1[.font2[ ``` ## # A tibble: 42 x 4 ## test_item condition sample_size response ## <dbl> <chr> <chr> <dbl> ## 1 1 category large 7.60 ## 2 1 category medium 7.32 ## 3 1 category small 6.07 ## 4 1 property large 7.16 ## 5 1 property medium 6.66 ## 6 1 property small 5.78 ## 7 2 category large 7.51 ## 8 2 category medium 7.17 ## 9 2 category small 6.26 ## 10 2 property large 7.20 ## # … with 32 more rows ``` ]]] ]] <!-- *********** NEW SLIDE ************** --> --- class: split-50 bg-main1 .column.bg-main1[.content.vtop.center[ .pull.left[.pad1[.font2[ Locations (.orange[x] and .orange[y]) are aesthetics ```r ggplot( data = frames_test, mapping = aes( * x = test_item, * y = response ) ) + geom_line() + facet_wrap(vars(condition)) ``` ]]] ]] .column.bg-main3[.content.vtop.center[ .pad1[.font2[ 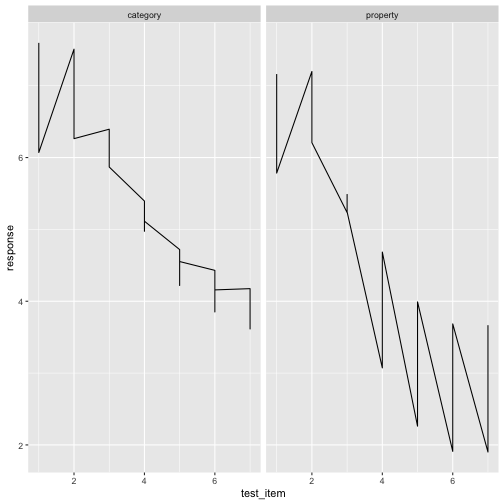<!-- --> ]] ]] <!-- *********** NEW SLIDE ************** --> --- class: split-50 bg-main1 .column.bg-main1[.content.vtop.center[ .pull.left[.pad1[.font2[ The .orange[colour] can be an aesthetic ```r ggplot( data = frames_test, mapping = aes( x = test_item, y = response, * colour = condition ) ) + geom_line() + facet_wrap(vars(condition)) ``` ]]] ]] .column.bg-main3[.content.vtop.center[ .pad1[.font2[ 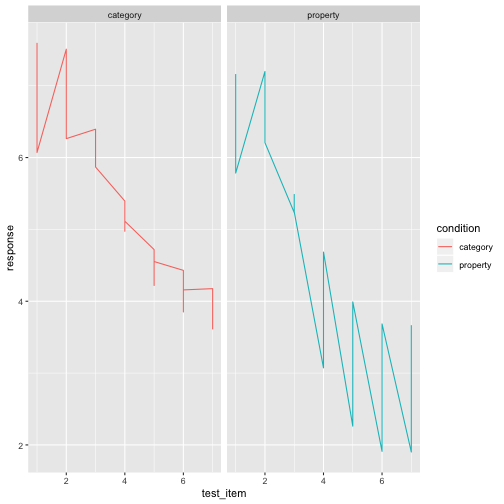<!-- --> ]] ]] <!-- *********** NEW SLIDE ************** --> --- class: split-50 bg-main1 .column.bg-main1[.content.vtop.center[ .pull.left[.pad1[.font2[ The .orange[group] can matter! ```r ggplot( data = frames_test, mapping = aes( x = test_item, y = response, colour = condition, * group = sample_size ) ) + geom_line() + facet_wrap(vars(condition)) ``` ]]] ]] .column.bg-main3[.content.vtop.center[ .pad1[.font2[ 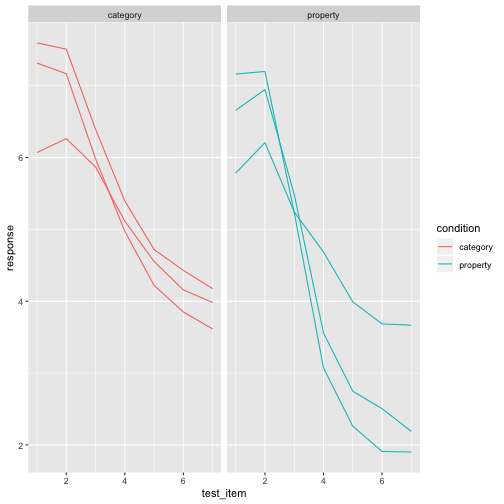<!-- --> ]] ]] <!-- *********** NEW SLIDE ************** --> --- class: split-50 bg-main1 .column.bg-main1[.content.vtop.center[ .pull.left[.pad1[.font2[ But maybe we want to colour by sample size ```r ggplot( data = frames_test, mapping = aes( x = test_item, y = response, colour = sample_size, * group = sample_size ) ) + geom_line() + facet_wrap(vars(condition)) ``` ]]] ]] .column.bg-main3[.content.vtop.center[ .pad1[.font2[ 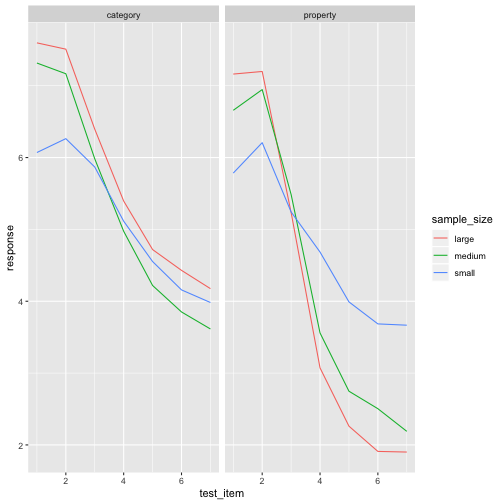<!-- --> ]] ]] <!-- *********** NEW SLIDE ************** --> --- class: split-50 bg-main1 .column.bg-main1[.content.vtop.center[ .pull.left[.pad1[.font2[ The .orange[fill] can be an aesthetic ```r ggplot( data = frames, mapping = aes( x = response, * fill = sample_size ) ) + geom_histogram() + facet_wrap(vars(condition)) ``` ]]] ]] .column.bg-main3[.content.vtop.center[ .pad1[.font2[ 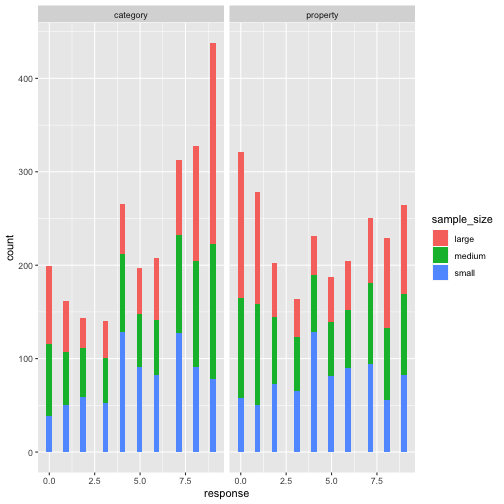<!-- --> ]] ]] <!-- *********** NEW SLIDE ************** --> --- class: split-50 bg-main1 .column.bg-main1[.content.vtop.center[ .pull.left[.pad1[.font2[ These are terrible colours. Use palettes instead! ```r # install.packages("RColorBrewer") library(RColorBrewer) display.brewer.all() ``` ]]] ]] .column.bg-main3[.content.vtop.center[ .pad1[.font2[ 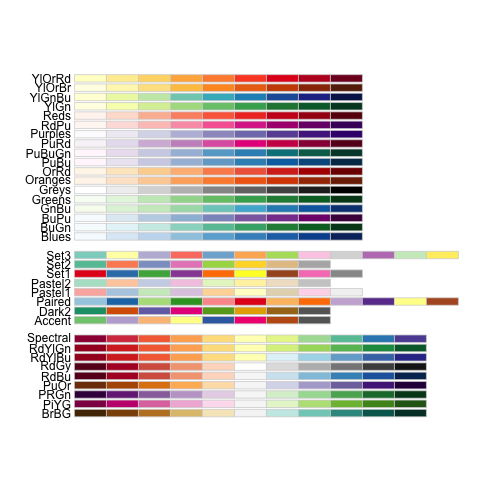<!-- --> ]] ]] <!-- *********** NEW SLIDE ************** --> --- class: split-50 bg-main1 .column.bg-main1[.content.vtop.center[ .pull.left[.pad1[.font2[ Can do fills... ```r ggplot( data = frames, mapping = aes( x = response, fill = sample_size ) ) + geom_histogram() + *scale_fill_brewer(palette = "Dark2") + facet_wrap(vars(condition)) ``` ]]] ]] .column.bg-main3[.content.vtop.center[ .pad1[.font2[ 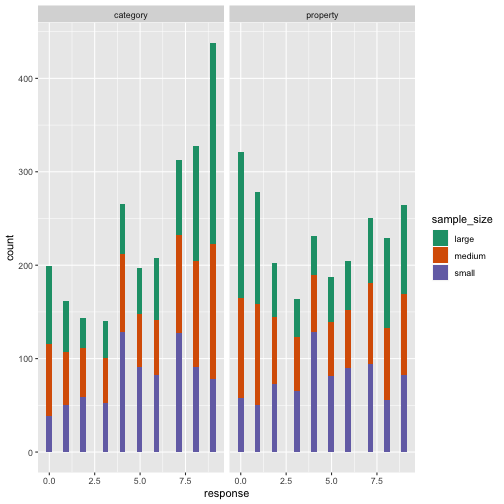<!-- --> ]] ]] <!-- *********** NEW SLIDE ************** --> --- class: split-50 bg-main1 .column.bg-main1[.content.vtop.center[ .pull.left[.pad1[.font2[ And colours... ```r ggplot( data = frames_test, mapping = aes( x = test_item, y = response, colour = sample_size, group = sample_size ) ) + geom_line() + *scale_color_brewer(palette = "Set1") + facet_wrap(vars(condition)) ``` ]]] ]] .column.bg-main3[.content.vtop.center[ .pad1[.font2[ 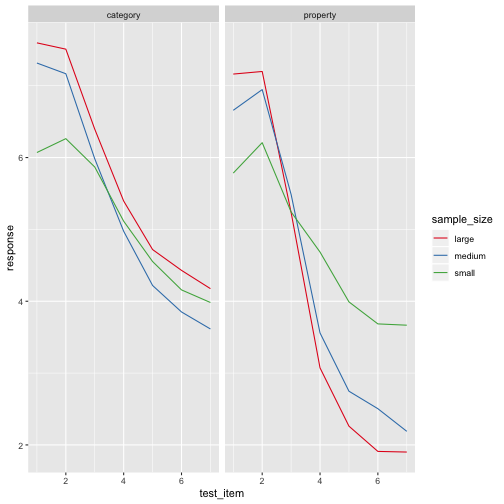<!-- --> ]] ]] <!-- *********** NEW SLIDE ************** --> --- class: white bg-black center middle hide-slide-number .pad1[ .font4[ Exercise 02<br> ]] <!-- *********** NEW SLIDE ************** --> --- class: bg-main1 center middle hide-slide-number .reveal-text.bg-main2[.pad1[ .font4[Geoms] ]] <!-- *********** NEW SLIDE ************** --> --- class: split-50 bg-main1 .column.bg-main1[.content.vtop.center[ .pull.left[.pad1[.font2[ Points and lines are "simple" geoms ```r ggplot( data = frames_test, mapping = aes( x = test_item, y = response, colour = sample_size, group = sample_size ) ) + *geom_line() + facet_wrap(vars(condition)) ``` ]]] ]] .column.bg-main3[.content.vtop.center[ .pad1[.font2[ <!-- --> ]] ]] <!-- *********** NEW SLIDE ************** --> --- class: split-50 bg-main1 .column.bg-main1[.content.vtop.center[ .pull.left[.pad1[.font2[ Points and lines are "simple" geoms ```r ggplot( data = frames_test, mapping = aes( x = test_item, y = response, colour = sample_size, group = sample_size ) ) + *geom_point() + facet_wrap(vars(condition)) ``` ]]] ]] .column.bg-main3[.content.vtop.center[ .pad1[.font2[ 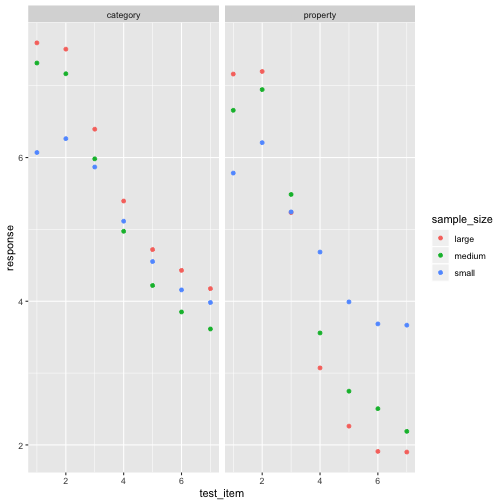<!-- --> ]] ]] <!-- *********** NEW SLIDE ************** --> --- class: split-50 bg-main1 .column.bg-main1[.content.vtop.center[ .pull.left[.pad1[.font2[ Geoms can be layered and take parameters ```r ggplot( data = frames_test, mapping = aes( x = test_item, y = response, colour = sample_size, group = sample_size ) ) + *geom_point(size=4) + *geom_line() + facet_wrap(vars(condition)) ``` ]]] ]] .column.bg-main3[.content.vtop.center[ .pad1[.font2[ 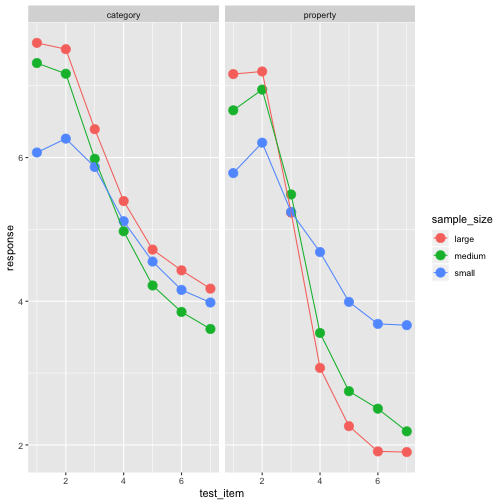<!-- --> ]] ]] <!-- *********** NEW SLIDE ************** --> --- class: split-50 bg-main1 .column.bg-main1[.content.vtop.center[ .pull.left[.pad1[.font2[ The order of geoms matters ```r ggplot( data = frames_test, mapping = aes( x = test_item, y = response, colour = sample_size, group = sample_size ) ) + *geom_line() + *geom_point(size=4) + facet_wrap(vars(condition)) ``` ]]] ]] .column.bg-main3[.content.vtop.center[ .pad1[.font2[ <!-- --> ]] ]] <!-- *********** NEW SLIDE ************** --> --- class: split-50 bg-main1 .column.bg-main1[.content.vtop.center[ .pull.left[.pad1[.font2[ Geoms come in many varieties... ```r ggplot( data = frames_small, mapping = aes( x = sample_size, y = response ) ) + *geom_boxplot() + facet_wrap(vars(condition)) ``` ]]] ]] .column.bg-main3[.content.vtop.center[ .pad1[.font2[ 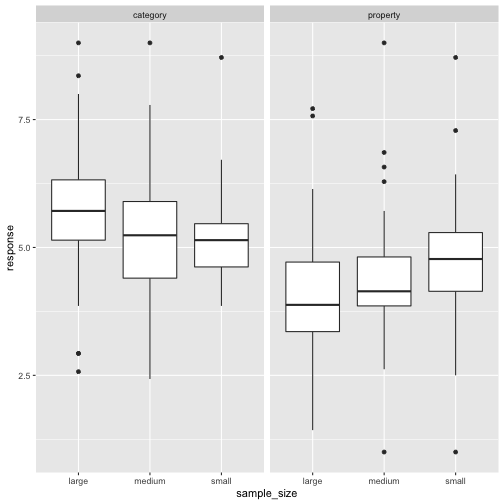<!-- --> ]] ]] <!-- *********** NEW SLIDE ************** --> --- class: split-50 bg-main1 .column.bg-main1[.content.vtop.center[ .pull.left[.pad1[.font2[ Geoms come in many varieties... ```r ggplot( data = frames_small, mapping = aes( x = sample_size, y = response ) ) + *geom_violin() + facet_wrap(vars(condition)) ``` ]]] ]] .column.bg-main3[.content.vtop.center[ .pad1[.font2[ 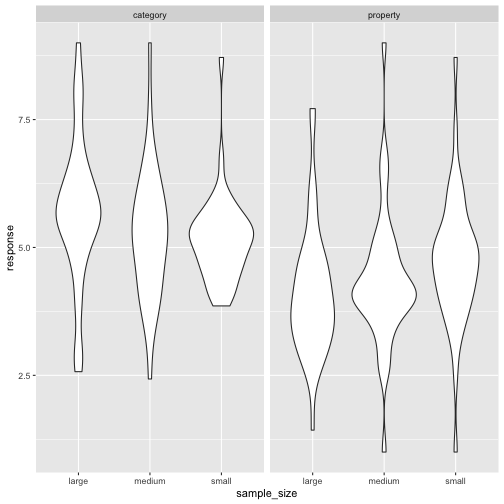<!-- --> ]] ]] <!-- *********** NEW SLIDE ************** --> --- class: split-50 bg-main1 .column.bg-main1[.content.vtop.center[ .pull.left[.pad1[.font2[ Geoms come in many varieties... ```r ggplot( data = frames_small, mapping = aes( x = sample_size, y = response ) ) + geom_violin() + *geom_jitter() + facet_wrap(vars(condition)) ``` ]]] ]] .column.bg-main3[.content.vtop.center[ .pad1[.font2[ 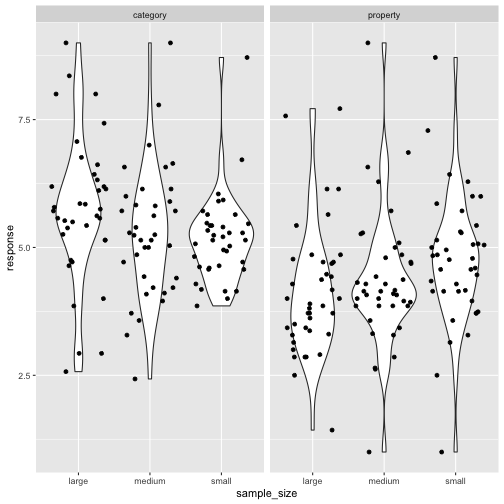<!-- --> ]] ]] <!-- *********** NEW SLIDE ************** --> --- class: split-50 bg-main1 .column.bg-main1[.content.vtop.center[ .pull.left[.pad1[.font2[ Geoms come in many varieties... ```r ggplot( data = frames_small, mapping = aes( x = sample_size, y = response ) ) + geom_violin() + *geom_jitter(alpha=0.5,size=3) + facet_wrap(vars(condition)) ``` ]]] ]] .column.bg-main3[.content.vtop.center[ .pad1[.font2[ 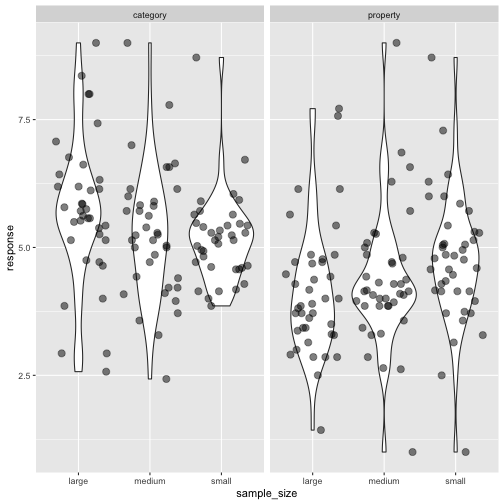<!-- --> ]] ]] <!-- *********** NEW SLIDE ************** --> --- class: split-50 bg-main1 .column.bg-main1[.content.vtop.center[ .pull.left[.pad1[.font2[ Geoms come in many varieties... ```r ggplot( data = frames, mapping = aes( x = test_item, y = response ) ) + *geom_count() ``` ]]] ]] .column.bg-main3[.content.vtop.center[ .pad1[.font2[ 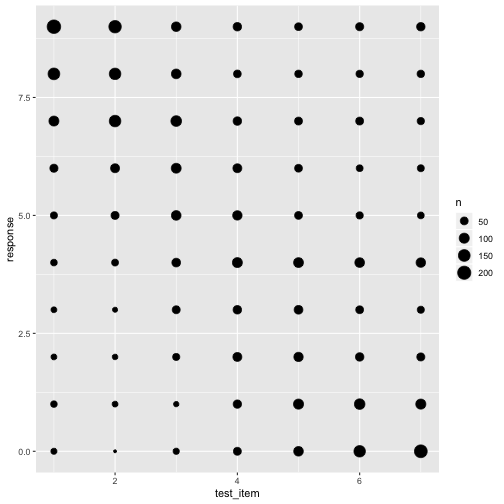<!-- --> ]] ]] <!-- *********** NEW SLIDE ************** --> --- class: split-50 bg-main1 .column.bg-main1[.content.vtop.center[ .pull.left[.pad1[.font2[ Geoms come in many varieties... ```r ggplot( data = frames, mapping = aes( x = test_item, y = response ) ) + geom_count() + *facet_grid(condition ~ sample_size) ``` ]]] ]] .column.bg-main3[.content.vtop.center[ .pad1[.font2[ 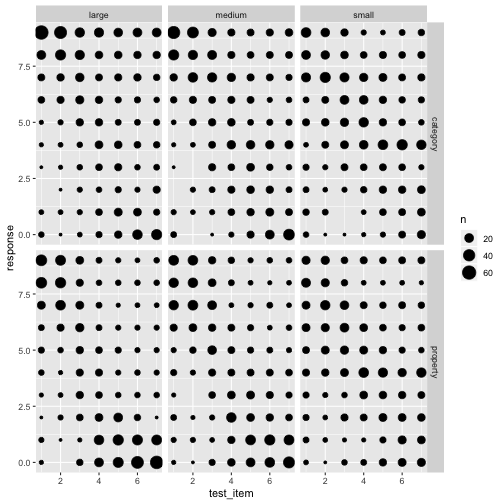<!-- --> ]] ]] <!-- *********** NEW SLIDE ************** --> --- class: split-50 bg-main1 .column.bg-main1[.content.vtop.center[ .pull.left[.pad1[.font2[ Geoms come in many varieties... ```r ggplot( data = frames, mapping = aes( x = test_item, y = response ) ) + *geom_count(aes(colour = ..n..)) + facet_grid(condition ~ sample_size) ``` ]]] ]] .column.bg-main3[.content.vtop.center[ .pad1[.font2[ 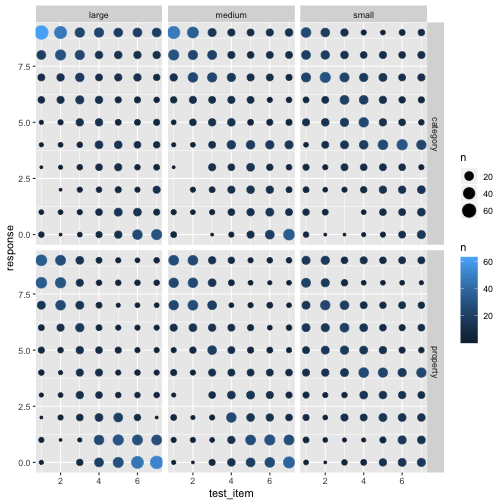<!-- --> ]] ]] <!-- *********** NEW SLIDE ************** --> --- class: split-50 bg-main1 .column.bg-main1[.content.vtop.center[ .pull.left[.pad1[.font2[ Geoms come in many varieties... ```r ggplot( data = frames, mapping = aes( x = test_item, y = response ) ) + geom_point(size=4) + *geom_smooth() + facet_wrap(sample_size ~ condition) ``` ]]] ]] .column.bg-main3[.content.vtop.center[ .pad1[.font2[ 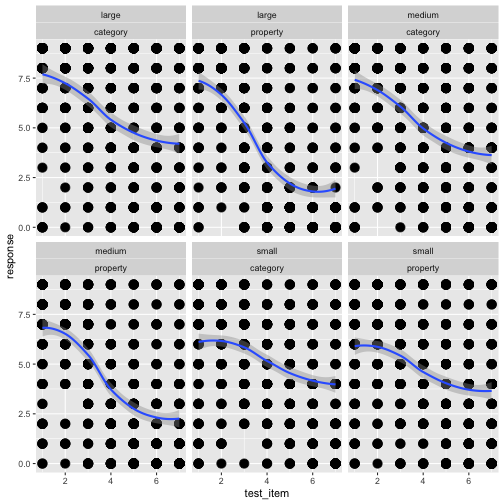<!-- --> ]] ]] <!-- *********** NEW SLIDE ************** --> --- class: bg-main1 center middle hide-slide-number .reveal-text.bg-main2[.pad1[ .font4[Error bars,<BR>contours] ]] <!-- *********** NEW SLIDE ************** --> --- class: split-50 bg-main1 .column.bg-main1[.content.vtop.center[ .pull.left[.pad1[.font2[ Summarise with errors ```r library(lsr) frames_mean <- frames %>% group_by( condition, sample_size, test_item ) %>% summarise( resp = mean(response), lower = ciMean(response)[1], upper = ciMean(response)[2] ) frames_mean ``` ]]] ]] .column.bg-main3[.content.vtop.center[ .pad1[.font2[ ``` ## # A tibble: 42 x 6 ## # Groups: condition, sample_size [6] ## condition sample_size test_item resp lower upper ## <chr> <chr> <dbl> <dbl> <dbl> <dbl> ## 1 category large 1 7.60 7.16 8.04 ## 2 category large 2 7.51 7.14 7.88 ## 3 category large 3 6.39 5.95 6.84 ## 4 category large 4 5.39 4.86 5.93 ## 5 category large 5 4.72 4.13 5.30 ## 6 category large 6 4.43 3.79 5.07 ## 7 category large 7 4.18 3.53 4.82 ## 8 category medium 1 7.32 6.85 7.78 ## 9 category medium 2 7.17 6.80 7.54 ## 10 category medium 3 5.98 5.54 6.42 ## # … with 32 more rows ``` ]] ]] <!-- *********** NEW SLIDE ************** --> --- class: split-50 bg-main1 .column.bg-main1[.content.vtop.center[ .pull.left[.pad1[.font2[ Plot the error bars ```r frames_mean %>% ggplot(aes( x = test_item, y = resp, colour = condition )) + geom_point() + geom_line() + geom_errorbar(aes( ymin = lower, ymax = upper )) + facet_wrap(~sample_size) ``` ]]] ]] .column.bg-main3[.content.vtop.center[ .pad1[.font2[ 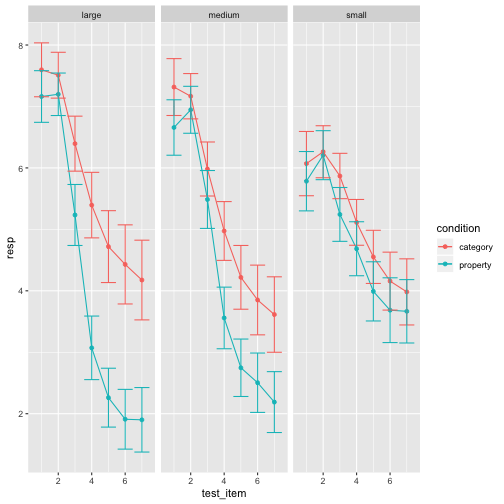<!-- --> ]] ]] <!-- *********** NEW SLIDE ************** --> --- class: split-50 bg-main1 .column.bg-main1[.content.vtop.center[ .pull.left[.pad1[.font2[ Let's also make contours ```r frames_test %>% ggplot(mapping = aes( x = test_item, y = response, colour = condition)) + geom_point() + theme_bw() + geom_density_2d() + facet_wrap(~condition) + ylim(0,9) ``` ]]] ]] .column.bg-main3[.content.vtop.center[ .pad1[.font2[ 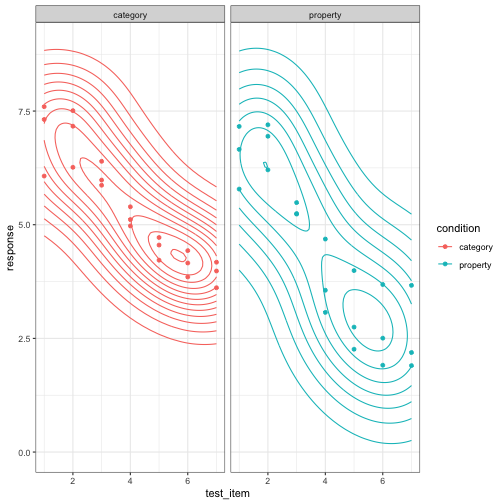<!-- --> ]] ]] <!-- *********** NEW SLIDE ************** --> --- class: white bg-black center middle hide-slide-number .pad1[ .font4[ Exercise 04: Play!<br> ]]